by R.I. Pienaar | Mar 5, 2008 | Code, Front Page
Apache has its native mod_status status page that many people use to pull stats into tools such as Cacti and other RRDTool based stats packages. This works well but does not always provide enough details, questions such as these remain unanswered:
- How many of my requests are GET and how many are POST?
- How many 404 errors and 5xx errors do I get on my site as a whole and for script.php specifically?
- What is the average response time for the whole server, and for script.php?
- How many Closed, Keep Alive and Aborted connections do I have?
To answer this I wrote a script that keeps a running track of your Apache process, it has many fine grained controls that let you fine tune exactly what to keep stats on. I got the initial idea from an old ONLamp article titled Profiling LAMP Applications with Apache’s Blackbox Logs.
The article proposes a custom log format that provides the equivelant to an airplanes blackbox, a flight recorder that records more detail per request than the usual common log formats do. I suggest you read the article for background information. The article though stops short of a full data parser so I wrote one for a client who kindly agreed that I can opensource it.
Using this and some glue in my Cacti I now have graphs showing a profile of the requests I receive for the whole site, but as you are able to apply fine grained controls to select what exactly you’ll see, you could get per server overview stats and details for just a specific scripts performance and statuses:


The script creates on a regular interval a file that contains the performance data, the data is presented in variable=value data pairs, I will soon provide a Cacti and Nagios plugin to parse this output to ease integration into these tools.
The performance data includes values such as:
- Amount of requests in total
- Total size of requests separated by in and out bytes
- Average response time
- Total processing time.
- Counts of connections in Close, Keep Alive and Aborted states.
- Counts for each valid HTTP Status code, and aggregates for 1xx, 2xx, 3xx, 4xx and 5xx.
- The amount of GET and POST requests.
- And detail for each and every unique request the server serves.
See the Sample Stats for a good example, variables are pretty self explanatory. To keep the data set small and manageable 2 selectors exist, one to choose which requests to keep details for and which to keep stats for. These can be combined with standard Apache directives such as Location to provide very fine grained stats for all or a subset of your site.
You would need some glue to plug this into Cacti and Nagios, I will provide a script for this soon as I have time to write up some docs for it.
Install guide etc can be found on my GitHub there is also extensive Perldoc Docs in the script, the GitHub also have links to downloading the script.
by R.I. Pienaar | Jun 2, 2007 | Code
I’ve been doing a whole lot of programming recently and even getting into doing some MySQL stored procedure and trigger programming. I got a copy of the excellent book MySQL Stored Procedure Programming and can recommend it to anyone keen to get information on the subject.
Usually when dealing with errors in stored procedures or triggers you define a handler for the MySQL error code and either continue – and presumably do something to handle the exception – or exit with an error. When doing an UPDATE with a WHERE clause that does not match any data though no error gets thrown, it just doesn’t do anything.
So I tried to come across some samples of how to get the affected row count but came up short – there are very few online resources that I found about MySQL stored procedures in general. So here is a solution for a simple trigger that updates a table when new data arrives in another.
DELIMITER $$
CREATE TRIGGER trg_update_latest_on_email_stats
AFTER INSERT ON email_stats
FOR each row
BEGIN
DECLARE l_rows INT DEFAULT 0;
UPDATE server_stats SET last_email_time = NEW.time
WHERE server_name = NEW.server_name;
/* how many rows did we affect? */
SELECT ROW_COUNT() INTO l_rows;
/* If we didn't update any rows, then insert new data */
IF (l_rows = 0) THEN
INSERT INTO server_stats (server_name, last_email_time)
VALUES (NEW.server_name, NEW.time);
END IF;
END $$
That’s it, pretty simple stuff.
Data comes in, the trigger fires but if there is no data there nothing happens, so it inserts some data and future updates will pass.
I could have used the REPLACE function for simpler code, but my solution should be faster which is key when using trigggers.
by R.I. Pienaar | Dec 28, 2006 | Code
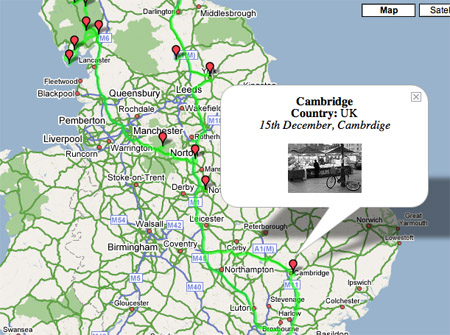
After my recent release of version 1.6 I realized you wouldn’t always want to have a clickable point at every line point so version 1.7 introduces a fix for this.
First a sample:

You can see there are few points and the line just gets drawn through points that aren’t clickable. This is a much more practical approach to it since with version 1.6 you’d have had 2000 clickable markers on that map, not good.
To activate this feature there is now a special type called none, if you specify this as the type for a point it won’t get a marker, no comments, not clickable etc. You can also therefore not define your own types using the word none since they just won’t work.
As a side note, the image you see above is from a map with very close to 2000 points on it, the map works on my iMac with 1GB RAM but I’ve seen it fail on other smaller machines, it seems the problem is related to the time the javascript takes to run so the browsers kill the javascript. This is the first time I came across limitation in this so all I can say is if you intend to make huge maps, test it on smaller machines as well.
This version also fixes a small error in the HTML that my code produce, this didn’t break anything but it’s best to stick to what GMap EZ expect.
Version 1.7 is available at http://www.devco.net/code/gmapsphp-current.tgz as always and the docs at http://www.devco.net/pubwiki/GMapsPHP have been updated.
by R.I. Pienaar | Nov 29, 2006 | Code
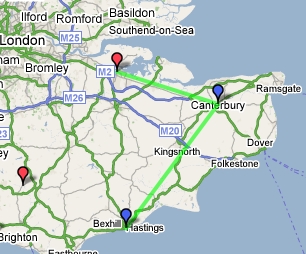
GMapEZ has supported drawing lines using the Google Maps API for a while now, but I’ve always put off implimenting this since I thought it would be quite a bit of work and involve lots of changes in my XML format. I finally decided to impliment it today and I found a very easy way to assign points to lines.
First an example map so you can see what you can achieve:

The line thickness, color and opacity is configurable on a per-line basis and you can assign any point in your existing data file to a line on the map, to achieve this I extended the XML data using a <linemember> element, here is an example point:
<point>
<lat>51.393522</lat>
<long>0.527054</long>
<type>visit</type>
<title>Chatham Historic Dockyard</title>
<country>England</country>
<href>http://www.chdt.org.uk/</href>
<linktext>Home Page</linktext>
<linemember>1</linemember>
</point>
The points on the line get connected in order that they appear in your data file.
To configure the line created above you can add a [line1] section to your configuration file, simply match up the linemember numbers with the lineX section in your config, a sample:
[line1]
color = #00ff00
width = 2
opacity = 0.6
This will draw the line in the image above, I think it’s very simple and it should be 100% backward compatible with your exiting data should you choose not to use this feature.
As always you can get the code at http://www.devco.net/code/gmapsphp-current.tgz the documentation at http://www.devco.net/pubwiki/GMapsPHP has also been updated to reflect these changes.
by R.I. Pienaar | Aug 25, 2006 | Code
I previously blogged about a parser for pcap files that will show all SQL queries, you can now get the code for this tool here. It’s very simple, help is in the comment block right at the beginning of the file.
by R.I. Pienaar | Aug 10, 2006 | Code
I’ve several pairs of Cisco PIX failover clusters, till now I’ve never really monitored their status because I do not have snmp-trap servers but today I discovered one pair did a failover due to a cable problem a while ago so I figured it’s time I do something about it.

I’ve written a quick guide on using Nagios, Net-SNMP and a few MIBs from Cisco to monitor it and to alert you if any change in the status of your failover clusters happen.
You can get the full document on my Wiki at http://www.devco.net/pubwiki/PIX/MonitorFailoverWithNagios


