I love graphite, I think it’s amazing, I specifically love that it’s essentially Stats as a Service for your network since you can get hold of the raw data to integrate into other tools.
I’ve started pushing more and more things to it on my network like all my Munin data as per my previous blog post.
What’s missing though is a very simple to manage dashboard. Work is ongoing by the Graphite team on this and there’s been a new release this week that refines their own dashboard even more.
I wanted a specific kind of dashboard though:
- The graph descriptions should be files that you can version control
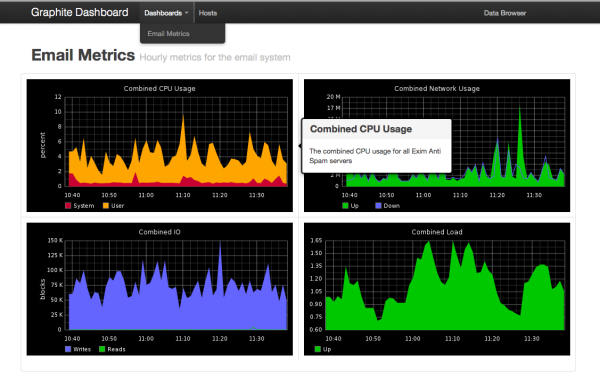
- Graphs should have meta data that’s visible to people looking at the graphs for context. The image below show a popup that is activated by hovering over a graph.
- Easy bookmarkable URLs
- Works in common browsers and resolutions
- Allow graphs to be added/removed/edited on the fly without any heavy restarts required using something like Puppet/Chef – graphs are just text files in a directory
- Dashboards and graphs should be separate files that can be shared and reused
I wrote such a dashboard with the very boring name – GDash – that you can find in my GitHub. It only needs Sinatra and uses the excellent Twitter bootstrap framework for the visual side of things.

click for full size
The project is setup to be hosted in any Rack server like Passenger but it will also just work in Heroku, if you hosted it on Heroku it would create URLs to your private graphite install. To get it going on Heroku just follow their QuickStart Guide. Their free tier should be enough for a decent sized dashboard. Deploying the app into Heroku once you are signed up and setup locally is just 2 commands.
You should only need to edit the config.ru file to optionally enable authentication and to point it at your Graphite and give it a name. After that you can add graphs, the example one that creates the above image is in the sample directory.
More detail about the graph DSL used to describe graphs can be found at GitHub, I know the docs for the DSL needs to be improved and will do so soon.
I have a few plans for the future:
- As I am looking to replace Munin I will add a host view that will show common data per host. It will show all the data there and you can give it display hints using the same DSL
- Add a display mode suitable for big monitors – wider layout, no menu bar
- Some more configuration options for example to set defaults that apply to all graphs
- Add a way to use dygraphs to display Graphite data
Ideas, feedback and contributions welcome!

